Name Section
VS117 LABORATORY IV:
THE ACCOMMODATIVE STIMULUS-RESPONSE FUNCTION
INTRODUCTION
Theoretically, the accommodative response should make the
target point conjugate with the retina, assuming the eyes have
infinite resolution ability and the retinal image is not distorted.
This assumption would be correct if the optical system of the
eye could focus an exact point-for-point image upon the retina.
However, due to various factor such as chromatic aberration,
spherical aberration, and diffraction, the retinal image can never
be perfect and the resolution is limited. These factors, together
with the size of the pupil, result in a distance range over which
the target appears equally clear. This distance range is called
the 'depth of focus.' Whenever any part of depth of focus lies
upon the retina, vision is said to be clear because no clearer
vision is ever experienced by the person. In clinic refraction,
the optical correction usually places this interval almost entirely
within the vitreous body (plus refraction bias). Therefore, a
considerable displacement of an object toward the eye is necessary
before this interval lies behind the retina, thereby bring accommodation
into action. When accommodation occurs, no greater adjustment
is ordinarily made than is required to bring an extremity of this
interval upon the retina.
The purpose of this experiment is to determine the magnitude
of changes in accommodation brought about by changes in fixation
distance and by use of lenses. No attempt will be made to eliminate
the effect of pupil size.
EXPERIMENTAL PROCEDURE
APPARATUS: Badal optometer, distance and reduced Snellen charts,
and trial lenses.
METHODS: One member of your group will serve as a subject.
If possible, select a subject with small refractive error. Have
the observer place her/his head in the chin rest and fixate a
Snellen chart 3 m away. Adjust the chin rest to bring the eyes
to the proper level in front of the lens cells. Align the subject
in the haploscope. Be sure that there is little, if any, apparent
lateral or vertical motion of the stigma as it is moved back and
forth along the haploscope arm.
PROCEDURE:
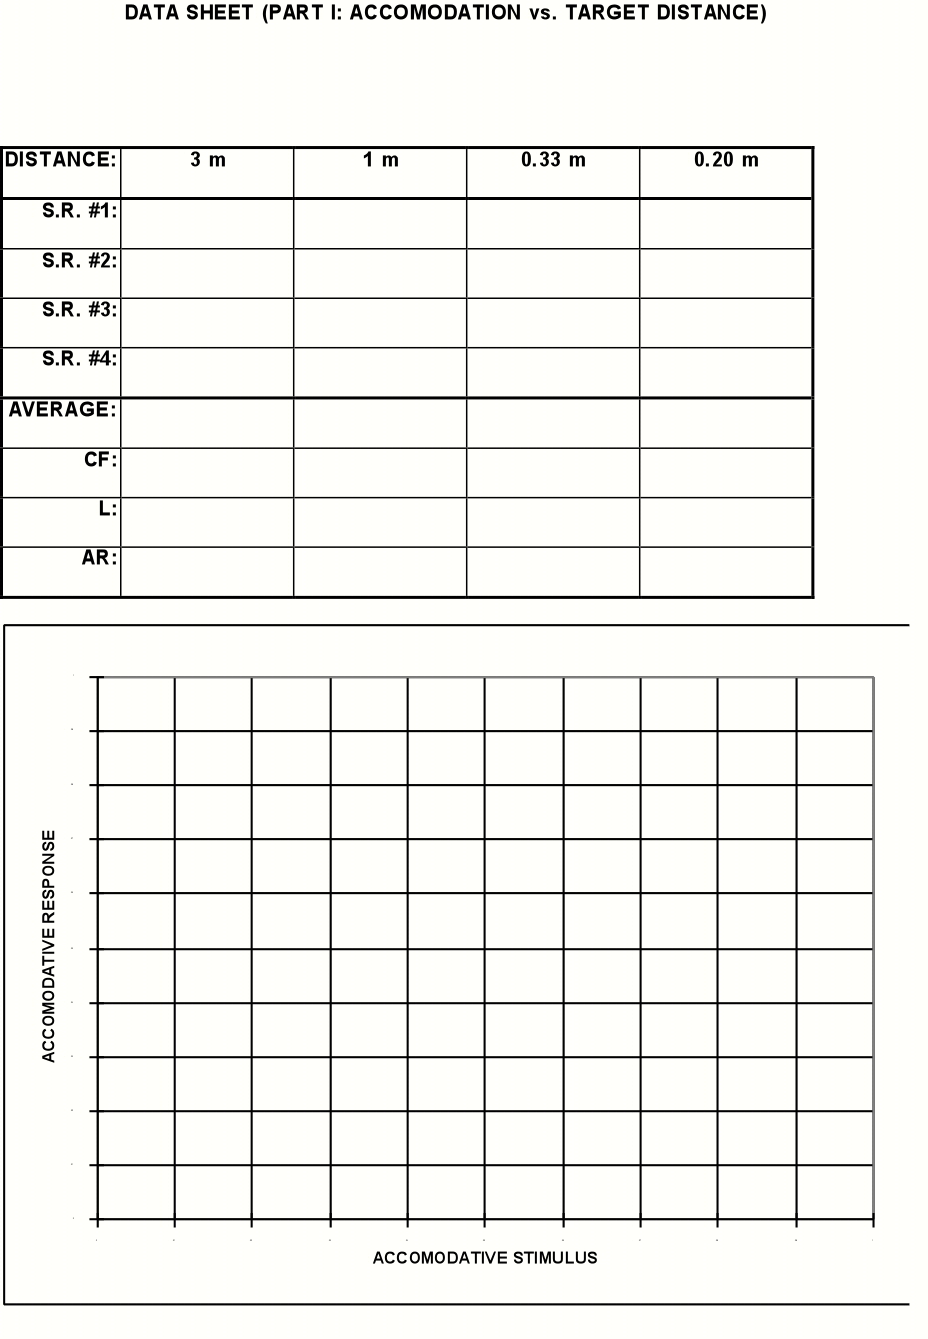
PART 1. ACCOMMODATION AS A FUNCTION OF TARGET DISTANCE
Occlude the left eye. Measure the scale reading (s.r.) four
times for each of the following Snellen chart distances from the
middle lens cell: 3 m, 1 m, 33 cm, 20 cm. Use the distance Snellen
chart for the 3m distance and the reduced Snellan chart for the
other distances. Calculate the mean s.r. value for each target
distance. If your readings for a particular target distance show
a range greater than 1cm, take four additional readings to see
if a greater consistency for the s.r. value can be obtained.
PART 2. ACCOMMODATION AS A FUNCTION OF TRIAL LENS POWER
Occlude the left eye. Place the reduced Snellen chart 50cm from
the middle lens cells. Measure the scale reading (s.r.) four
times each with trial lens powers ranging from +2D to -6D in 1D
increments. Large lens powers can be made from two smaller lens
powers.
REPORT
For this lab, each group should turn in a single report containing
the following:
A. Graphs of the accommodative stimulus-response function.
B. Discussion.
C. Data sheet from the lab.
A. GRAPHS OF THE ACCOMMODATIVE STIMULUS-RESPONSE FUNCTION
Part 1. Plot the the accommodative response for each of the four
target distances. The vertical axis should be accommodative response
and the horizontal axis should be the reciprocal of target distance.
Both axes should be in units of diopters. Use the formulas from
Lab III to calculate any terms you may need, such as the stigma
to Badel distance (d1), the conjugate focus (CF), the accommodative
demand (AD), and the accommodative response (AR).
Part 2. Plot the the accommodative response for each of the nine
trial lenses. The vertical axis should be accommodative response
and the horizontal axis should be the trial lens power. Both
axes should be in units of diopters.
B. DISCUSSION
1. Would you expect the accommodative response curve of Part
1 to be higher or lower than the accommodative response curve
of Part 2? Why?
2. Theoretically, the accommodative stimulus-response function
should look like Figure 1 below.

Figure 1: Theoretical accommodative stimulus-response function
a) Describe why the accommodative response curve plateaus at
point D, why it plateaus at point F, and why it is linear at
point E.
b) Why is the accommodative response curve below the demand
(1:1) line?
3. Theoretically, would the accommodative response to a distant
target viewed through a -2D trial lens be greater or less than
the accommodative response to a 50cm target viewed without a trial
lens?
VS117 LABORATORY IV: THE ACCOMODODATIVE STIMULUS-RESPONSE
FUNCTION