VS117
Lab # 1 Accommodative Response
INTRODUCTION
The accommodative response of the eye reflects a change in the dioptric power of the intraocular lens, driven by feedback from blur on the retina. In an ideal system, the Accommodative Response would exactly match the accommodative demand, and blur would be eliminated completely. In the human eye, there are several factors which limit the ability to detect blur, and these limitations produce errors of accommodation. Chromatic aberration and spherical aberration, together with pupil size, cause the retinal image to be somewhat blurred even with perfect optical conjugacy of retina and object. Thus, the eye has an apparent depth of focus, and whenever any part of this focal interval lies upon the retina, vision is said to be clear, because no clearer vision is ever experienced by the subject. When accommodation occurs, no greater adjustment is ordinarily made than is required to bring an extremity of this interval upon the retina. For distant targets, greater than 1 meter (< 1D), there is typically a lead of accommodation, such that the eye is accommodated at about +.5D, even with 0D demand. For nearer targets, there is typically a lag of accommodation such that the accommodative response is around -0.5 D less than the accommodative demand. For very near targets, the ability to accommodate reaches its limit and the accommodative response is constant. Figure 1 illustrates the accommodative response versus accommodative demand relationship.
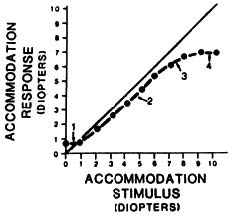
Fig. 1: Accommodative response function. Solid line indicates a perfect response. Filled circles indicate measured responses for various levels of the stimulus.
In this lab, we will measure the accommodative response of the eye when subjects are presented with targets that produce various levels of accommodative demand.
EQUIPMENT
Supplied: Haploscope with Badal Optometer Meter
Stick
Trial Lenses Accommodative
Targets
The principal piece of equipment used for this lab is a Badal Optometer, which allows a subject to adjust the focus of a small target (called a stigma) while at the same time he/she is attempting to accommodate to some real target in space. The adjusted position of the stigma then indicates the dioptric power of the eye, and from this the accommodative response can be calculated by removing the factors produced by refractive error and any lenses at the spectacle plane.
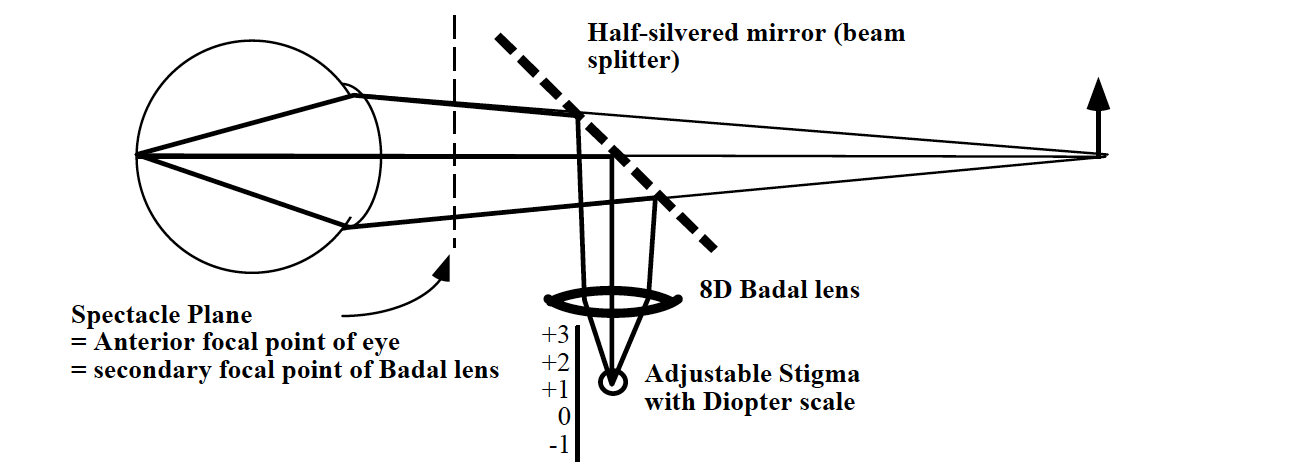
Figure 2: Badal Optometer System with beam splitter and adjustable Stigma. Stigma is adjusted to be conjugate to retina, indicating actual accommodative response of eye when fixating a real target at some distance.
• Badal
Optometer
A device that measures refractive errors without direct use of trial lenses. Its main component is a +8D or +10.00 D Badal Lens and Badal Target called the Stigma or a pinhole spot of light. A Badal optical system is one in which an object (i.e. the stigma) that is viewed through the Badal lens can be moved toward or away from the eye without changing the angular subtense (magnification) of the retinal image, yet still allowing a change of optical vergence. This is accomplished by placing a convex lens in front of the eye so that the secondary focal point of the lens coincides with the primary focal point of the eye’s optical system (approximately the spectacle plane: 1.5 cm from the eye). A change from the emmetropic conjugate position suggests a change in the refractive or accommodative status of the eye
The apparatus you will use for this experiment has two Badal systems, one for each eye. Each system is mounted on an arm that is part of a haploscope (a form of Wheatstone mirror stereoscope). Each arm provides a support for a moveable stigma (point light source), a Badal lens, a lens holder with several cells, and a half silvered mirror. The mirror is used for several reasons. The first is to dissociate or separate the images seen by each eye. The second is to allow each eye to see two views simultaneously, one that is straight ahead and the other is 90o to the side. The straight ahead target is the stimulus to accommodation. The side target is the Stigma that is used to measure the accommodative response. Only the right Badal system will be use in this experiment.
An important advantage of this system is that the distance from the Badal lens to the stigma is directly proportional to the dioptric power required to focus on it. The stigma is set so that its image is formed on the retina while the eye accommodates to the straight ahead target. The reciprocal of the distance between the spectacle plane and the image of the stigma formed by the Badal lens is called the conjugate focus(CF). Badal optometers that we will use have a linear scale indicating the distance of the stigma from the Badal lens and we use this to compute the Conjugate Focus of the image of the stigma in Diopters at the spectacle plane of the eye. The distance of the stigma from the Badal lens (SD) equals the scale reading minus a calibration constant K. The power of the Badal lens (+8 or +10) is indicated by (P).
CF= P- SD*P2
Thus for a stigma distance in meters (SD) of 5 cm (0.05 m) and a P value of+8D for the Badal lens CF=8- (0.05*64)=4.8D. From this conjugate focus (CF) the accommodative response (AR), or the refractive error (RE) can be calculated according to the relation:
CF = RE + AR + L (All units are in diopters.)
where
CF = conjugate focus of stigma (read from scale after setting)
RE = refractive error (RE = positive for myopes and negative for hyperopes)
AR = accommodative response (AR is positive if accommodation increases the eye's dioptric power, and negative if it decreases the eye's dioptric power.)
L= auxiliary lenses in the spectacle plane*
* The spectacle plane is assumed coincident with the first focal plane of the eye, and, throughout this experiment, accommodative response, refractive error, and any accessory lenses put in the cells will be regarded as having their effects in the spectacle plane, i.e., there will be no need to take account of positional power as far as RE, AR, and L are concerned.
Similarly, the Accommodative Stimulus (AS) can be calculated by knowing the Target Vergence (TV 1 / distance in meters), the refractive error (RE), and the lens power (L) according to the relation:
TV = RE + AS + L
which rearranges to
AS = TV
- RE - L
The following examples illustrate how refractive error and the accommodative response can be calculated using the reading from the Badal Optometer:
1. Refractive Error: An ametropic observer with accommodation relaxed sets the stigma at a scale reading of +1D. As stated earlier, when a setting is made, the stigma is conjugate to the retina and the scale reading indicates the Conjugate Focus (CF) of the retina. Since zero accommodation is in force we can determine the refractive error of the test eye from the relations discussed earlier.
Recall that
CF = RE + AR + L
With no trial lens in place, and accommodation relaxed...
+ 1.0 = RE + 0 + 0 Therefore, the test eye is + 1.0 D myopic
2. Accommodative Response: The same 1.0 D myopic eye fixates a near target through (not by reflection) the half-silvered mirror. When the stigma is set for conjugacy the scale reading is +2.8D. How much accommodation is in force, i.e., what is the accommodative response?
2.8 D = RE + AR+ L = +1.0 + AR + 0
2.8 - 1.0 = AR = + 1.8 D Therefore, the accommodation in force is +1.8 D
3. Accommodative Response: An emmetrope (RE = 0) views a distant target through the half-silvered mirror. A -5.00 D lens is placed in the spectacle plane to stimulate accommodation. The scale reading for conjugacy of stigma to the retina is -1.0D. Calculate the amount of accommodation actually used (accommodative response).
-1.0 = RE + AR + L
= 0 + AR + (-5.0)
= 0 + AR - 5.0
AR = 5.0 - 1.0
= +4.0 D
Thus, the actual accommodation in force under the given condition is +4.0 D. Note that in this case, the Accommodative Demand was +5.0 D, (TV = 0, RE = 0, L = -5.0, so AD = 0 - 0 - [-5.0]) so the 1.0 D difference represents a lag of accommodation.
Procedure:
|
|
Haploscope alignment: Adjust chin rest and forehead rest so that the pole of the subject’s cornea is lined up with the small marks in the alignment sight. The figure at left shows the view of the experimenter when the subject is properly aligned. The final adjustment is the IPD of the haploscope, which should be matched to the far PD of the subject. When properly aligned, the stigma image should not appear to move horizontally or vertically when it’s focus is adjusted. If horizontal motion is observed, try adjusting the PD to minimize it. Do this for both eyes. |

Calibration: The Badal Optometers have been calibrated for you, with a scale taped to the side of the arms which allows for readings to be made directly in Diopter units.
Measurements: Pick
subjects with little or no refractive error, or who are corrected with contact
lenses. This will simplify the
calculations. When making measurements with the Badal Optometer,
it is critical that the subject should not accommodate to the stigma. The subject should keep attention on the
real target and make a judgment of the stigma’s focus using peripheral
vision. The other critical thing is
that the subject should adjust the stigma in and out to find the middle of
the clear range. The intent here is
to measure the conjugate focus, which is at the center of the Interval of Sturm
(see above).
I: Accommodative response to targets at different real distances:
• Occlude the left eye.
• place the accommodative target at 1 M in front of right eye
• subject looks intently at the accommodative target
• subject focuses the right Badal target using peripheral vision
• record from the right accommodative scale on the right vergence arm
• take four (4) readings and average
• repeat for 3 m, 33 cm, 20 cm and 10 cm right eye test distances. Use the distance Snellen
chart for the 3m distance and the reduced Snellan chart for the other distances.
• Calculate the mean SD. value for each target distance. If your readings for a particular target
distance show a range greater than 1cm, take four additional readings to see if a greater consistency for the SD. value can be obtained. Average the four settings for each target distance.
• Plot the Accommodative Response against the Accommodative Stimulus on the graph provided. Label your axes! Indicate with a line what the perfect response curve would look like.
II: Accommodative response to targets at different optical distances:
• Occlude the left eye.
• place +2.0 D lens into the right lens drop well
• place the accommodative target at 0.5 M in front of right eye
• subject looks intently at the accommodative target
• focus the right Badal target using peripheral vision
• record from the right accommodative scale on the right vergence arm
• take four (4) readings and average
• repeat for +2.00, + 1.0 D, 0.0 D (no lens),-1.00, - 2.0 D, - 3.0D, - 4.0 D, -5.0 and -6.0 D right eye lenses. Large lens powers can be made from two smaller lens powers.
• Average the four settings for each lens value.
• Plot the Accommodative Response against the Accommodative Stimulus on the graph provided. Label your axes! Indicate with a line what the perfect response curve would look like.
DATA SHEET
Part I: Real Distances:
|
3 M |
1.0M |
0.33M |
0.2M |
0.1M |
|
1. |
1. |
1. |
1. |
1. |
|
2. |
2. |
2. |
2. |
2. |
|
3. |
3. |
3. |
3. |
3. |
|
4. |
4. |
4. |
4. |
4. |
|
Ave |
Ave |
Ave |
Ave |
Ave |
|
AR |
AR |
AR |
AR |
AR |
|
AD |
AD |
AD |
AD |
AD |
Part
II: Optical Distances:
|
2.0D |
1.0D |
0.0D |
-1.0D |
-2.0D |
|
1. |
1. |
1. |
1. |
1. |
|
2. |
2. |
2. |
2. |
2. |
|
3. |
3. |
3. |
3. |
3. |
|
4. |
4. |
4. |
4. |
4. |
|
Ave |
Ave |
Ave |
Ave |
Ave |
|
AR |
AR |
AR |
AR |
AR |
|
AD |
AD |
AD |
AD |
AD |
Part
II: Optical Distances continued:
|
-3.0D |
-4.0D |
-5.0D |
-6.0D |
|
|
1. |
1. |
1. |
1. |
|
|
2. |
2. |
2. |
2. |
|
|
3. |
3. |
3. |
3. |
|
|
4. |
4. |
4. |
4. |
|
|
Ave |
Ave |
Ave |
Ave |
|
|
AR |
AR |
AR |
AR |
|
|
AD |
AD |
AD |
AD |
|
Graph accommodative stimulus on the X -axis and accommodative response on the Y -axis
GRAPH SHEET:
|
PART I: Real Distances |
|
|
|
|
|
|
|
Part II: Optical Distances |
|
|
|
|
REPORT
For this lab, each group should turn in a single report containing the following:
A. Graphs of the accommodative stimulus-response function.
B. Discussion.
C. Data sheet from the lab.
A. GRAPHS OF THE ACCOMMODATIVE STIMULUS-RESPONSE FUNCTION
Part 1. Plot the accommodative response for each of the five target distances. The vertical axis should be accommodative response and the horizontal axis should be the reciprocal of target distance. Both axes should be in units of diopters. Use the formulas to calculate any terms you may need, such as the stigma to Badel distance (SD), the conjugate focus (CF), the accommodative demand (AD), and the accommodative response (AR).
Part 2. Plot the accommodative response for each of the nine trial lenses. The vertical axis should be accommodative response and the horizontal axis should be the AS= TV – L - RE. Both axes should be in units of diopters.
B. DISCUSSION
1. Would you expect the accommodative response curve of Part 1 to be higher or lower than the accommodative response curve of Part 2? Why?
2. Theoretically, the accommodative stimulus-response function should look like Figure 1 below.
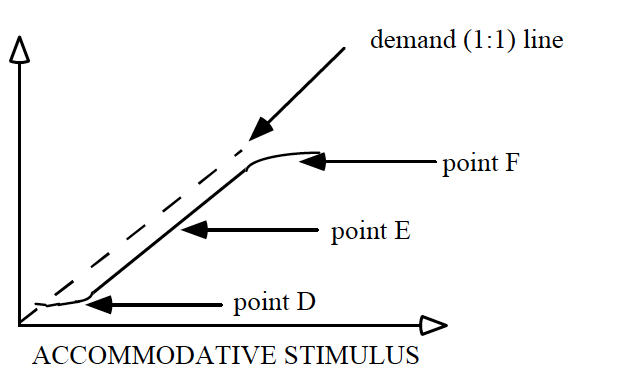
Figure 1: Theoretical accommodative stimulus-response function
a) Describe why the accommodative response curve plateaus at point D, why it plateaus at point F, and why it is linear at point E.
b) Why is the accommodative response curve below the demand (1:1) line?
3. Theoretically, would the accommodative response to a distant target viewed through a -2D trial lens be greater or less than the accommodative response to a 50cm target viewed without a trial lens?
4. What happens to your measurements if the subject accommodates to the stigma?