VS117
Lab # 2 AC/A Ratio Measurement
INTRODUCTION
Whenever the eye makes an Accommodative (A) response, there is a yoked vergence response called Accommodative Convergence (AC) that occurs even under monocular viewing. If the two systems were perfectly yoked, then for every Sphere Diopter of accommodation there would be 1 Meter Angle of convergence, equal to 6 Prism Diopters for a 6cm interpupillary distance. We express the degree to which accommodation can drive convergence using the AC/A Ratio, which is the amount of Accommodative Convergence in Prism Diopters divided by the amount of Accommodation in Sphere Diopters. Thus, if the two systems were perfectly yoked one would have an AC/A ratio of about 6. (More precisely, it would be the same as the PD in cm.). In practice, the AC/A ratio is usually less than this, indicating that the convergence is less than required for the change in distance specified by the accommodation.
An analogous ratio can be described which expresses the Accommodation that occurs secondary to a disparity driven Convergence change, referred to as the Convergent Accommodation / Convergence (CA/C) ratio. Each system drives the other, a relationship referred to as synkinesis.
The purpose of this laboratory is to determine the amount of accommodative convergence per unit of accommodation described clinically as the AC/A ratio. The AC/A ratio is measured in two basic ways, referred to as Calculated AC/A and Gradient AC/A. The Calculated AC/A is determined indirectly from measures of phoria at far and near. The Gradient AC/A is measured directly by stimulating accommodation with lens or distance changes, and measuring the convergence that occurs. In this lab, we will measure the Gradient AC/A.
Recall from the previous lab that the Accommodative Response does not exactly equal the Accommodative Stimulus. In particular, there is usually a Lag of Accommodation for near targets. Thus, if a subject is presented with a target at 1 Meter and then the target is moved to 0.5 Meters, a change in the stimulus of 1 D, it is likely that the Accommodative Response will be somewhat less that 1D. Therefore, the Gradient AC/A will depend on whether the Accommodative Stimulus or the Accommodative Response is used to calculate it. This yields two types of Gradient AC/A, Response AC/A and Stimulus AC/A. Because the Stimulus AC/A overestimates the amount of accommodation that occurs, it usually underestimates the AC/A ratio. We will measure both and compare them.
When measuring AC/A, it is important that there should be no Disparity Vergence target. That is, there should be no stimulus to fusion, so that the convergence angle is determined by the Accommodative Convergence component. This is accomplished by having only one eye view the accommodative target. Recall, though, that there is also a Proximal component to vergence, and as a target is brought nearer to a subject it will stimulate some convergence due to the perceived change in distance from the change in angular size and other distance cues. Because adding lenses doesn’t stimulate the Proximal Vergence component, one sometimes sees a difference in the amount of convergence during AC/A measurements depending on whether accommodation is stimulated by changing distance or addition of lenses. In this lab, we will try it both ways to see if there is a difference.
SUMMARIZING, we will measure the Gradient AC/A in two ways: by changing target distance (stimulates Proximal Convergence) and by adding lenses (doesn’t stimulate Proximal Convergence). For each, we will compare the Response AC/A to the Stimulus AC/A.
EQUIPMENT
Supplied: Haploscope with Badal
Optometer, Meter Stick
Bring:
Trial Lenses, Accommodative
Target
The principal piece of equipment used for this lab is once again a Badal Optometer, which allows a subject to adjust the focus of a small target (called a stigma) while at the same time he/she is attempting to accommodate to some real target in space. In addition, we will take advantage of the adjustable arms that allow measurement of convergence angle. Figure 1 shows how to measure both accommodation and convergence using this apparatus. We will measure accommodative response with the left eye, assuming that it is the same as in the right eye (it almost always is). Only the right eye will see the target, and only the right eye will have lenses added.
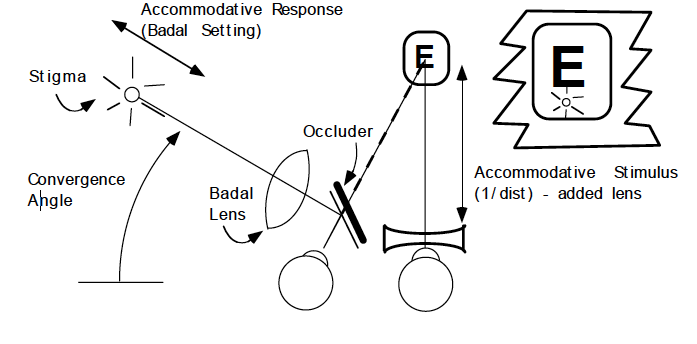
Figure 1: Using the Haploscope to measure Accommodative Response and Convergence Angle: The right eye views a target at some distance, through some lens. The left eye sees only the stigma. Accommodative response is determined from the setting of stigma to best focus while fixating on the target (letter “E”). Convergence is determined from adjustment of the haploscope arm so stigma appears lined up with point of fixation (see inset, showing stigma just below letter “E”).
The accommodation response measurement (Conjugate Focus) is made in the same way as in the previous lab. The accommodative stimulus is just the inverse of the target distance in meters, minus any lenses that have been added. For example, if the target is at 1 Meter, that produces a 1 D stimulus. If there is also a Plus 1 D lens, that is subtracted to give an overall stimulus of 0 D.
The convergence measurement depends on the fact that targets appear in the same visual direction when they fall on corresponding retinal points. If the left stigma is adjusted to be in the same visual direction as the fixated target (i.e., almost superimposed), then it indicates where the fovea of the left eye is pointing in space. If the left eye turns, the stigma must be turned by the same amount to keep it on the fovea, and thus we get a measure of the fixation direction of that eye. Because the other eye is always fixating straight ahead, the angle of the left eye equals the convergence angle.
It is critical that the target should be straight ahead for the right eye, so we will use the right stigma briefly to check this alignment. The right haploscope arm is set to zero degrees and the target is positioned so that it is aligned with the right stigma. The right stigma is then adjusted to measure accommodation. The left stigma is adjusted to be lower than the right stigma so that they will not be fused when seen at the same time. The position of the left stigma adjusted to point at the fixation target in order to measure convergence.
SUMMARIZING: Line up the target with the RIGHT STIGMA and
then set the LEFT STIGMA in the same horizontal direction but below the right
one. Measure Accommodation and Convergence with the RIGHT EYE Optometer. View target with RIGHT EYE. Add lenses to
the RIGHT EYE wells. FOCUS your eye on
the target, adjust the RIGHT EYE to be sharp. Note that the right eye
stigma will move laterally when you focus it and thus it cant be used to
measure eye position. Measure
convergence by adjusting the LEFT EYE stigma to be lined up with the
point of fixation.
Calibration: The Badal Optometers have been calibrated for you, with a scale taped to the side of the arms which allows for readings to be made directly in Diopter units.
Measurements: When
making measurements with the Badal Optometer, it is critical that the
subject should not accommodate to the stigma. The subject should keep attention on the real target and make a
judgment of the stigma’s focus using peripheral vision. The other critical thing is that the subject
should adjust the stigma in and out to find the middle of the clear range. The intent here is to measure the conjugate
focus. Likewise, when making
adjustments to the angle of the haploscope arm, the subject should concentrate
on the accommodative target and judge the position of the stigma using
peripheral vision.
I: Accommodative and Convergence response to targets at different far
optical distances:
• Place Occluder behind the left eye mirror, turn OFF the LEFT Stigma
• place the accommodative target at 3 M in front of right eye
• Turn ON the RIGHT Stigma, Set right haploscope arm to zero
• Line up target with Stigma,
• Turn ON the LEFT Stigma, and adjust its height below the RIGHT Stigma, .
• subject looks intently at the accommodative target
• subject adjusts the haploscope arm to line up the left stigma with the target.
• subject focuses the RIGHT Badal target
• record scale settings from the RIGHT Badal scale and the LEFT vergence arm scale.
• take three (3) readings and average
• repeat for : -1 D, -2 D, -4 D, and -6 D in the right lens well.
Average the three settings for each lens.
Plot the Accommodative Response against the Convergence Response on the graph provided. Label your axes! Plot the Accommodative Stimulus against the Convergence Response on the same graph, with different symbols. Label the graph with a key to show which symbols go with which type! Find the stimulus and response AC/A ratios from the slope of the function you measured. Pick a region where the function is reasonably straight. Indicate on the graph what these values are.
II: Accommodative response to targets at different near (0.5M) optical
distances:
• Place Occluder behind the left eye mirror, turn OFF the LEFT Stigma
• place the accommodative target at 0.5 M in front of right eye, with no lens in the well.
• Turn ON the RIGHT Stigma, Set right haploscope arm to zero
• Line up target with Stigma,
• Turn ON the LEFT Stigma, and set it below the RIGHT Stigma, .
• subject looks intently at the accommodative target
• subject adjusts the haploscope arm to line up the left stigma with the target.
• subject focuses the right Badal target
• record from the right Badal scale and the left vergence arm scale.
• take three (3) readings and average
• repeat for : +2.0 D, +1.0 D, -2 D, and -4 D in the right lens well.
• Average the three settings for each target distance.
Plot the Accommodative Response against the Convergence Response on the graph provided. Label your axes! Plot the Accommodative Stimulus against the Convergence Response on the same graph, with different symbols. Label the graph with a key to show which symbols go with which type! Find the AC/A ratio for each type from the slope of the function you measured. Pick a region where the function is reasonably straight. Indicate on the graph what these values are.
You will have a total of two graphs for this lab, with two curves on each. Turn in your data sheets and graphs before you leave lab.
B: Data sheet:
Table 1: Accommodative Convergence for Far Target
|
Lens in Cell (D) |
Acc. Stim. (D) |
Optometer Reading Scale Reading raw CF 1 2 3 Ave (D) |
AR (D) |
Vergence (deg) 1 2 3 Ave. |
Vergence (D) |
Vergence (MA) |
|
0 |
|
|
|
|
|
|
|
-1 |
|
|
|
|
|
|
|
-2 |
|
|
|
|
|
|
|
-4 |
|
|
|
|
|
|
|
-6 |
|
|
|
|
|
|
Table 2: Accommodative Convergence for Near Target
|
Lens in Cell (D) |
Acc. Stim. (D) |
Optometer Reading Scale Reading raw CF 1 2 3 Ave (D) |
AR (D) |
Vergence (deg) 1 2 3 Ave. |
Vergence (D) |
Vergence (MA) |
|
+2 |
|
|
|
|
|
|
|
+1 |
|
|
|
|
|
|
|
0 |
|
|
|
|
|
|
|
-2 |
|
|
|
|
|
|
|
-4 |
|
|
|
|
|
|
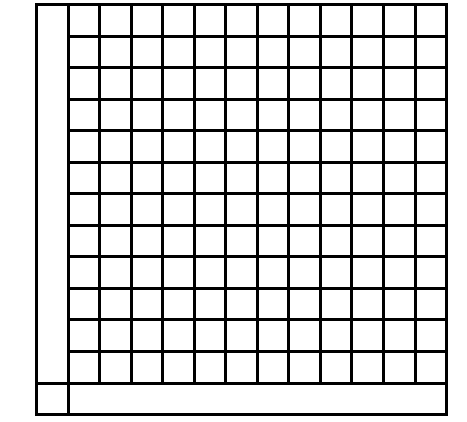
PART I: 3M Distances
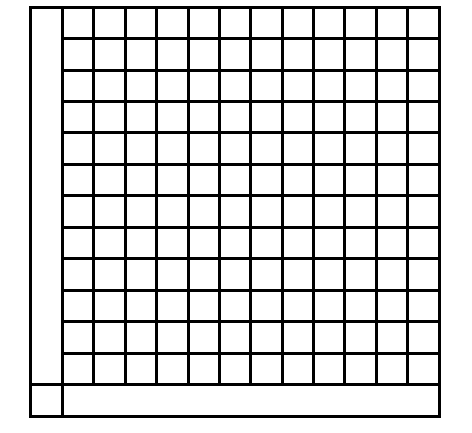
Part II: 0.5M Distances
REPORT
For this lab, turn in a single group report containing:
A. Graphs
B. Data sheets
A. Graph:
PART 1: Plot the accommodative vergence response (y-axis) versus the accommodative stimulus (x-axis) for the far target condition. On the same graph, plot the accommodative vergence response (y-axis) versus the accommodative response (x-axis) for the far target position. The vergence response should be plotted in units of prism diopters. Use the following formula to convert the vergence response from deg (which you measured on the haploscope) to prism diopters.
Prism
diopters [D]= 100 tan q,
where q equals convergence in degrees.
Determine the stimulus AC/A ratio and the response AC/A ratio for the far target condition. The slope of the line can be measured by fitting a linear regression to the data in the form of Y=aX +b where (a) is the slope and (b) is the Y intercept. The AC/A is measured by the slope. b equals the phoria when accommodation is at the far point.
PART 2: Repeat Part 1 for the near target condition.
Things to Think About...
How did the Response AC/A compare to the Stimulus AC/A?
Was there a difference between the values measured with the far and near viewing distance?
Were the functions straight lines or curved? Which would you expect to be more linear, Response or Stimulus curves?
Which type of measure, Response or Stimulus AC/A, is a better description of the yoking of Vergence to Accommodation?